Machine learning: what is it?
Machine learning is part of artificial intelligence. Hereby, computers will learn the behavior of data and will use this behavior to analyze new data and maybe try to predict values. Two parts can be separated here: supervised learning and unsupervised learning.
- In unsupervised learning, we group our data in similar groups, without predicting anything.
- With supervised learning, we have historical data where we know some properties and we want to predict these properties for new data (e.g. predicting when an event will happen or predict whether it will happen).
Both supervised and unsupervised learning have some subcategories.
Supervised learning has the following categories:
- Regression: We search for a function which predicts the outcome of a new set of input elements.
- Binary classification: In this case we will try to predict whether a product is in a certain category or not, where these categories are self-defined. An example of this is e.g. detecting if a component will break in the next 5 years.
- Classification: This is the same as Binary classification, but with more categories. We can use this e.g. to detect whether a component is likely to break in zero to 5 year, in five to 10 years, in 10 to 15 years or will keep on working for more than 15 years.
Unsupervised learning has following categories:
- Anomaly detection: In anomaly detection we will analyze existing data and look for a certain pattern in it. If new data comes in and has a different behavior, this data is possibly corrupted or will tell us about a defect.
- Clustering: Splitting the data in groups where all members have similar properties.
Example: predictive maintenance
Today, it is important to keep things working. If something breaks, it can disrupt a whole process which can result in high losses. This is why lots of companies renew a lot of their components after a certain amount of time.
However, this is not always optimal: depending on the circumstances, the possible lifetime of a product can vary a lot. Hereby we try to predict when a certain component will break, which allows us to use it longer than normally, which saves us money. For this remaining lifetime calculation, different machine learning techniques give us different possibilities:
- Regression: predicting in time when a component will fail
- Binary: Predicting if something will fail in the next x days
- Classification: Predicting if something will fail in the next x days, from day “X” to day “Y”, …
- Anomaly detection: detecting if the behavior of a component is diverging from the useful behavior.
- Recommendation: predict how much someone will like a movie, film, …
Setup and data preparation
As said, machine learning is just a part of the whole IoT and Big data story. It is a way of processing data, but it is very important to know what data you are dealing with and what you want to do with it. Before you start with the machine learning itself, you need an answer to next topics:
- What do you want to predict?
- Do you have data measures which are relevant to the topic/question?
- Is the data accurate?
- Is the data connected?
- Do you have enough data (because a lot of data is needed)?
You may have to preprocess your data to remove outliers and add new derived data. Keep in mind the type of data you want to predict, and what is the use of it. If you try to predict the end of the lifetime of a component, maybe a component of an aircraft, you like to predict the failure too early then too late. There are some solutions to this problem:
- In Binary classification, lots of algorithms will allow you to work with chances, e.g. the group of components which have a likelihood from more than 5% to fail.
- Keep in mind the type of data you work with! It is very unlikely to have lots of data from defects. Which can influence your prediction.
- Copy samples which makes you have more samples of failed components
The machine learning algorithm
Depending on what your needs are, you choose your machine learning algorithm. I already talked about supervised and unsupervised learning, and which categories you have within them. But also within every category you have Machine learning techniques to choose about. For choosing the right ML technique, you can use the ML cheat sheet as represented in figure 1.
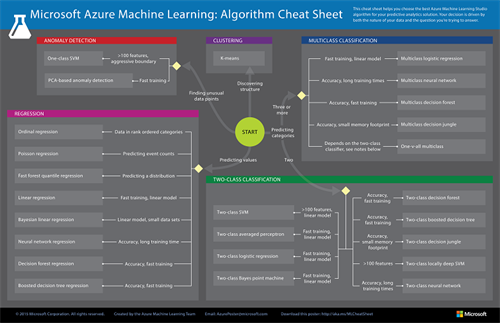
Figure 1: ML cheat sheet (source: https://azure.microsoft.com/en-us/documentation/articles/machine-learning-algorithm-cheat-sheet/)
Between this cheat sheet, you have to take into account that sometimes you have to justify your decisions, which needs a transparent machine learning process. Hereby it can be a good idea not choosing for algorithms like neural networks and forest trees, but for a transparent algorithm like linear regression.
Machine learning in azure
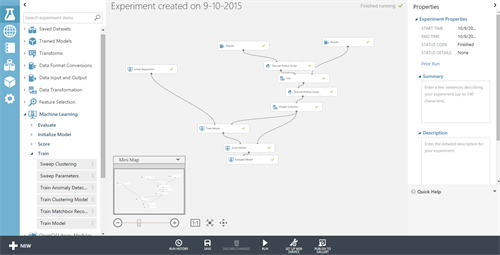
Machine learning in azure is very easy. With azure ML, you can drag and drop all the modules you need. Traditionally, you will start with your data sources as your data input to train your model.
Next you preprocess your data: remove outliers, remove or replace missing values, … and calculate derivate data like averages if you need to and haven’t done this yet. If you have your data on which you will train your model, you can split the data and use some of the data to test the model you build while training your model with the other data. For the model you simply can drag the algorithm you use and drag a training module which will, with the help of the training data, generate a trained model. You can evaluate this trained model if you want to make sure you do not overfit your data.
Next you can drag and drop the models you want to use and train them on your training data.
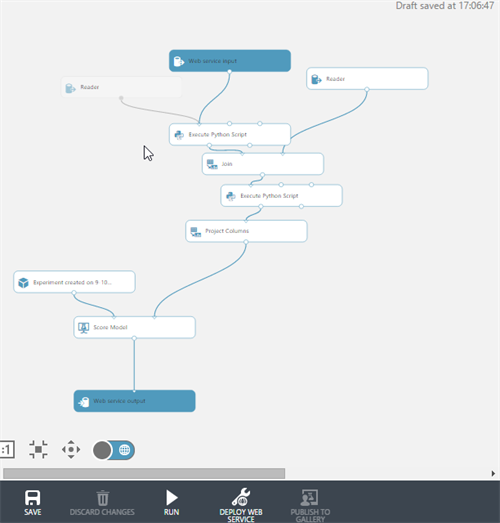
Generating your experiment
At the bottom side, press the button ‘set up web service’ to start setting up your web service. Run the new setup again, but don’t forget to remove the value you want to predict from the input! Also the data splitter, if you use one, has to be removed. Execute the program again and now you can set up a your web service. If you also want to train your experiment at runtime you can deploy your training experiment.
Example: Smart grids
A lot of times we can see how much prices can differ depending on time or place. But why are these prices so different? A lot of issues could cause this: economic problems, … In this part we will look more local and we will ask ourselves how we want to price our product. We calculate the optimal prices from our product with the help of price elasticity, forecast and optimization.
Price elasticity
Price elasticity expresses how your sell rate will change in function of your product price:

The elasticity will express whether your price is too high or too low:
- Elasticity < -1: elastic (high price low demand)
- Elasticity > -1 : Inelastic (low price high demand)
- Elasticity = -1: optimal = balance between price and demand
When we look to the graph we easily can find an optimal point. But this is only in the case we know the line and in the case the line only depends on the products price itself. Finding this line will be the next challenge.
With the help of taking the log of the elasticity formula and then the derivate of it, we can calculate the optimal price.
Forecast
The previous section gave us a pure theoretical example. In every practical case, we have to find this line through machine learning, with the help of linear regression. And hereby the price will not only depend from the price of the product itself, but also from the price of other products and other issues. In the final stage linear regression was fit to:
- The price of the product itself
- The price of competing products
- The type of the day, whereby we looked whether it’s weekend, a holiday, … They easily are to take into account by using a variable which is one in case of weekend, holiday, .. and zero in the other case
This linear regression will show us how the sales evolve in function of the prices. Not only its own price, but from the competing products as well. The input in the ML program are all the current prices of the different products, as well as properties of the product (like what the product contains and time of holidays). With the prediction, the availability of enough historical data is necessary.
Conclusion
Today, where a lot of data is available, machine learning can help us in a lot of cases. It can help to predict, classify, recommend things and has a lot of applications where it can be used in. It is part of automatisation where companies want to automate as much as possible without any human intervention, saving a lot of valuable time and money.
However, you always have to prepare your data in a proper way and you have to chose a good model which does not overfit nor underfit the available testdata.
Subscribe to our RSS feed