Introduction
I believe that we’ve all experienced the situation where you’re debugging an application and would like to step into the code of a dependent assembly that has been written by you or another team in your company but is not part of the current code repository.
Exposing the debug-information of that assembly via a symbol server allows you to do that.
While setting up a symbol-server and indexing pdb files was quite a hassle 10 years ago, it currently is a piece of cake when you use VSTS for your automated builds.
Build definition
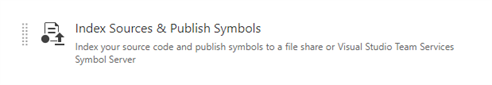
Additional information, such as where the source files can be found and what version of the sources were used during the build will be added to the pdb files.
Once this task has been added, it still needs some simple configuration:
Since VSTS is now also a symbol server, the easiest way to publish your symbols is to select Symbol Server in this account/collection.
When this option is selected, you should be good to go and don’t have to worry about the remainder of this article.
However, since some projects are configured with private build agents, I want to explore the File share Symbol Server type in this article.
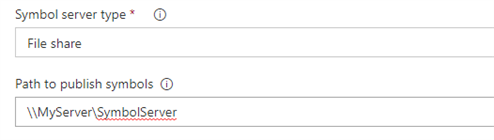
Select File Share as the Symbol Server type and specify the path to the location where the debug-symbols must be stored.
See the image below for an example:
At this point, you can trigger the build and verify if the Index sources & Publish symbols task succeeded.
If it succeeded, you should see that some directories are created in the location where the symbols should be stored and you should find pdb files inside those directories.
If nothing has been added to the folder, you should inspect the logs and see what went wrong.
Maybe no *.pdb files have been found, possibly because the path to the build-output folder is incorrect.
It seems that the Index sources & Publish symbols task does not support Portable pdb files. To expose debug information for these assemblies, SourceLink must be used, but this is beyond the scope of this article.
There is a quick workaround however: change the build settings of your project and specify that the debug information should not be portable but must be Full or Pdb only. This can be specified in the Advanced Build settings of your project in Visual Studio.
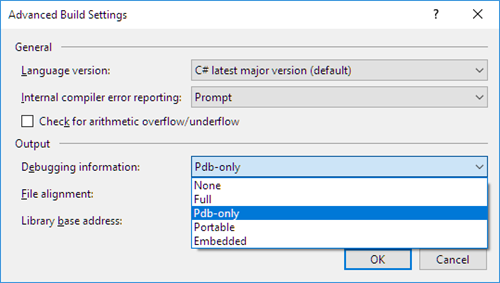
This workaround enables that the symbols can be indexed but using them while debugging will only be possible on Windows platforms which defeats a bit the purpose of having a .NET core assembly.
Exposing the debug symbols via HTTP
Now that the debug symbols are there, they should be exposed so that users of your assembly / package can make use of them.
One way to do this, is serving the symbols via a webserver.
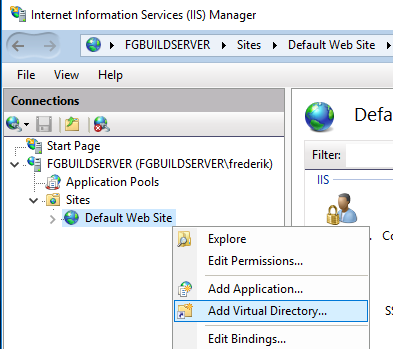
To do this, install and configure IIS on the server where your build agent runs.
Create a Virtual Directory
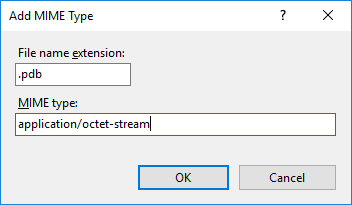
Configure MIME type for the pdb files
Authentication
Depending on who should have access to the debug-symbols, the correct authentication method has to be setup.
If anyone may download the debug symbols, then IIS must be configured to use Anonymous Authentication.
To enable Anonymous Authentication, open the Authentication pane in IIS and enable Anonymous Authentication. If the Anonymous Authentication option is not listed, then use Turn Windows feature on and off to enable it.
Having access to the debugging information does not imply that everybody also has access to the source code, as we’ll see later in the article.
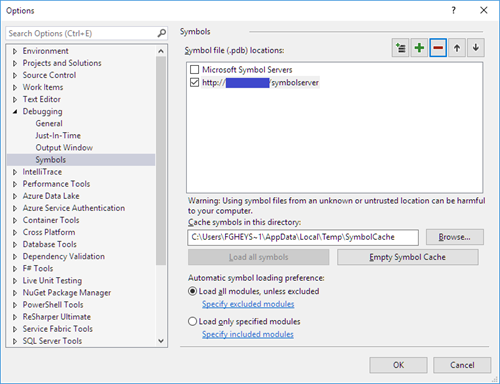
Configure Visual Studio to access the symbol server
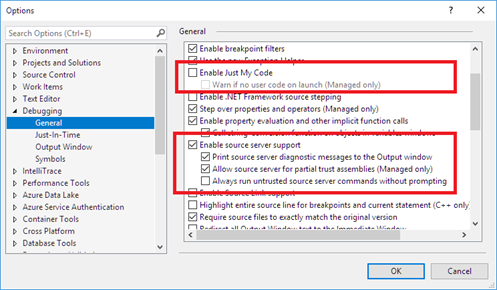
Now, everything should be in place to be able to debug through the source of an external library, as we’ll see in the next section.
In Action
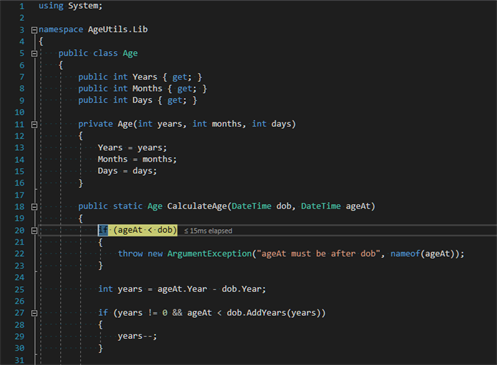
When everything is setup correctly, you should now be able to step through the code of an external library.
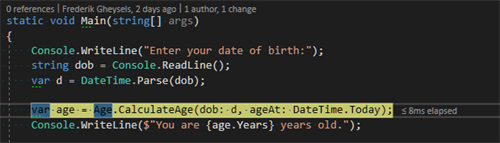
As an example, I have a little program called AgeCalculator that uses a simple NuGet package AgeUtils.Lib for which I have exposed its symbols:
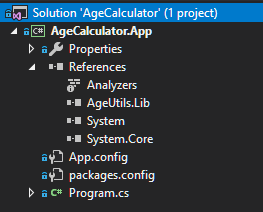
While debugging the program, you can see in the Modules window of Visual Studio that symbols for the external dll AgeUtils.Lib have been loaded. This means that Visual Studio has found the pdb file that matches the version of the AgeUtils.Lib assembly that is currently in use.
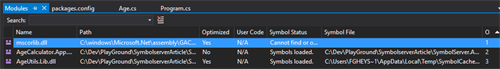
The debugger knows how this file is named, which version is required and where it can be found since all information is present in the pdb file that it has downloaded from the symbol server!
When the debugger attempts to retrieve the correct code-file, you’ll need to enter some credentials. Once this is done, the source-file is downloaded and you’ll be able to step through it:
Happy debugging!
Subscribe to our RSS feed