Missed everything about the rally? Don’t worry – read about it on the Microsoft Internet of Things blog.
Connecting our car to the cloud
The car was connected with the sensors, using the GrovePI starter kit, to a Rapsberry PI 3, running on Windows 10 IoT Core. This starter kit contains a set of sensors and actuators that can easily be read, leveraging the .NET SDK that is provided by the Grove team.
In order to connect the device with the Azure backend, Nebulus™ IoT Gateway was used. This is our own software gateway that can be centrally managed, configured and monitored. The gateway is built in .NET core and can run in Azure IoT Edge.
The GPS signals were read from the Serial port, while the other sensors (temperature, sound, humidity…) were read, using the GPIO pins through the GrovePi SDK.
The gateway was configured, using buffering (as connectivity was not always guaranteed in tunnels or rural areas), so that all data was transmitted on reconnect.
Connectivity happened through 4G, used by a Mi-Fi device.
Real-time route & position
The most important part of the whole project: having a real-time map to see the current position of the car and show sensor data.
There aren’t many options to handle this, you can go low level websockets or use something like socket.io, but we chose to use SignalR given we are most familiar with the Microsoft stack.
The setup is fairly easy – You add NuGet packages, set up a hub class and implement the client library. We decided to go for the latest version which runs on .NET core. But the best thing about this new version is that there’s a Typescript library and yes it does work with Angular 5 ! To connect SignalR to our application we wrapped it in a service which we gave the name “TrackerService”.
Now all this data also had to be managed on the client, so this part is done with Ngrx, this is a redux clone for Angular but it has RxJs support! What this means is that the components don’t directly get data from the TrackerService nor does the service push any data to the components. Actually the TrackerService just dispatches an action with the payload received from SignalR, the action is then handled by a reducer, which updates the state. The components subscribe to the state and receive all the changes. The advantage of this is that you switch to `OnPush` change detection in all of the components which results in a performance boost.
The map
For the map we initially looked at Azure Location Based Services, but it currently doesn’t support the features we needed such as custom markers , at least not when we started with the project. This made us choose for Leaflet which is free and has a lot of interesting features. First of all it was very easy to show the total route by just passing in an array of gps coordinates into a polyLine function. The best part of Leaflet was that it was super easy to calculate the total distance of a route. Just reduce the gps array list and call the distanceTo-method using previous and current coordinates and you’ll get an estimated distance. No need to call an extra API!
Updating Leaflet data is just a matter of subscribing to the NgRx store and appending the real-time data to the current `poliyLine` and updating the position of the car marker.
Creating aggregates in near-real-time
In order to visualize how our team was doing we decided to create aggregates for every 15 minutes, hour for a variety of metrics like speed and altitude. We based these aggregates on the device telemetry that was sent to Azure IoT Hubs. Since we were already using Routes, we added a new one to that and included all events that can be consumed by our aggregation layer.
To perform these aggragates it was a no-brainer to go with Azure Stream Analytics given it can handle the ingestion throughput and it natively support aggregates by using Windowing, more specifically a Tumbling Window.
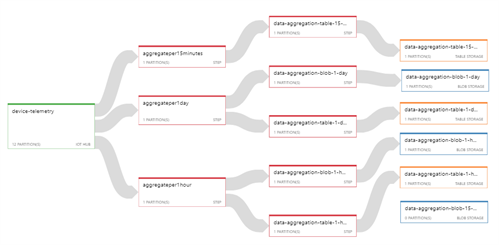
By using named temporal result sets we were able to capture the aggregate results in a result set and output it to the sinks that are required. This allows us to keep our script simple, but still output the same results without duplicating the business logic.
And that’s how we’ve built the whole scenario – Here are all the components we used in a high-level overview:
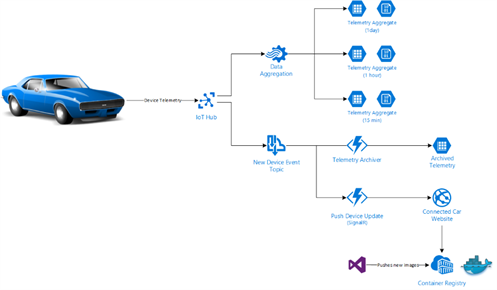
Want to have a look? You can find all our code on GitHub.
Thanks for reading,
Jan, Sam & Tom
Subscribe to our RSS feed