Define monitoring requirements
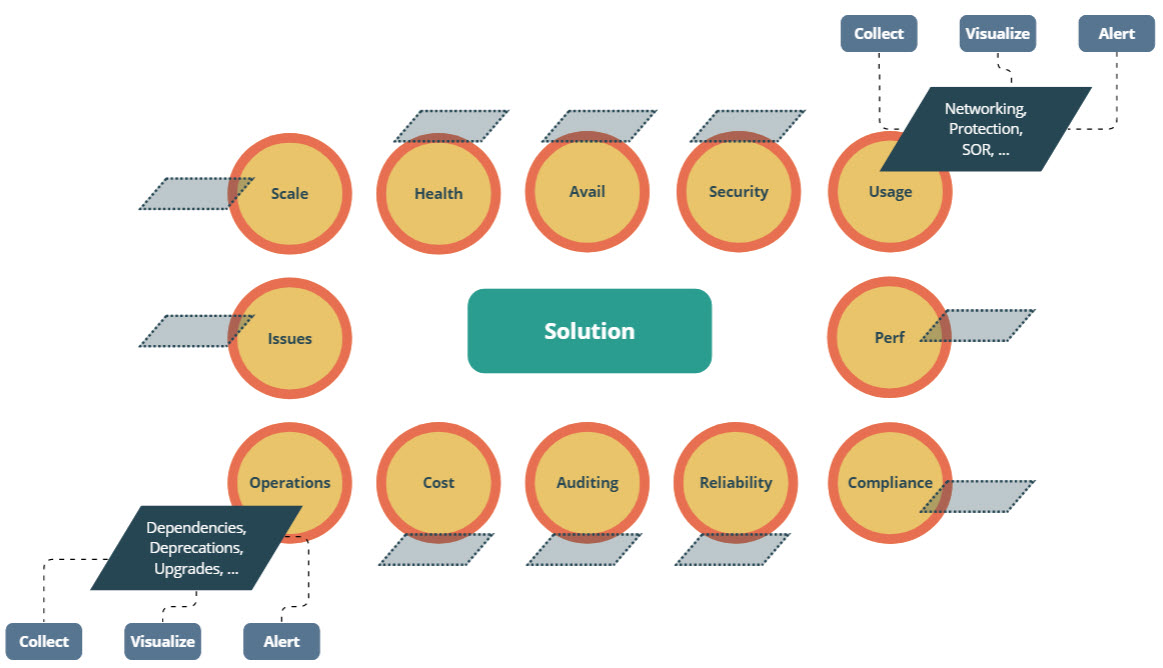
To define a monitoring scope, I normally start from a diagram like the following. For every single area, we define the observability requirements and their CVA, meaning: how to Collect, how to Visualize and how to Alert. Proactive monitoring is essential to maintaining a secure and healthy infrastructure, achieved through detecting and addressing issues promptly.
Let’s take the “usage” area as an example. To organize the requirements collection, we normally group the Azure components in functional categories like Networking (Virtual Network, NAT Gateway, Peering, VPN Gateway, DNS, Bastion, etc.), Protection (Firewall, Load Balancer, Private Links, Application Gateway, WAF, etc.), Identity, etc. For every category, we then describe: 1) the requirement, 2) which signals fulfill the requirement, 3) whether the signals are available or not, 4) how to generate them, 5) which ones only have to be collected, 6) which ones are collected and alerted, 7) how to dispatch the alert, 8) how to visualize them, etc. In other words, monitoring design is a complex beast!
Monitoring tools
Azure Monitor is the central monitoring platform in Azure that consolidates all the telemetry data from various cloud resources and applications into a “single” interface. However, referring to it as a “single” interface can be misleading, as monitoring capabilities are distributed across multiple interfaces and tools. The goal of having a comprehensive, out-of-the-box monitoring solution that offers a single pane of glass remains a utopia, and often bespoken solutions and third-party software are added to cover the full observability spectrum.
Establishing a landing zone monitoring and performing regular reviews and updates as the environment evolves is a challenging task. Fortunately, Microsoft has come to our help with a set of support tools that cover visualization, automated actions, cost management and more. The first initiative (announced here) is to provide a baseline for alerts, meaning a set of alerts based on metrics and logs queries that cover a classic enterprise landing zone setup. This is a big relief, as we don’t have to start from scratch and can rely on best practices from both Microsoft and multiple partners.
How does the alerts baseline tool work?
Well, everything is well explained in the wiki (https://github.com/Azure/alz-monitor/wiki) section of the alz-monitor repo. In this post, I want to summarize the essentials I’ve experienced while exploring this baseline.
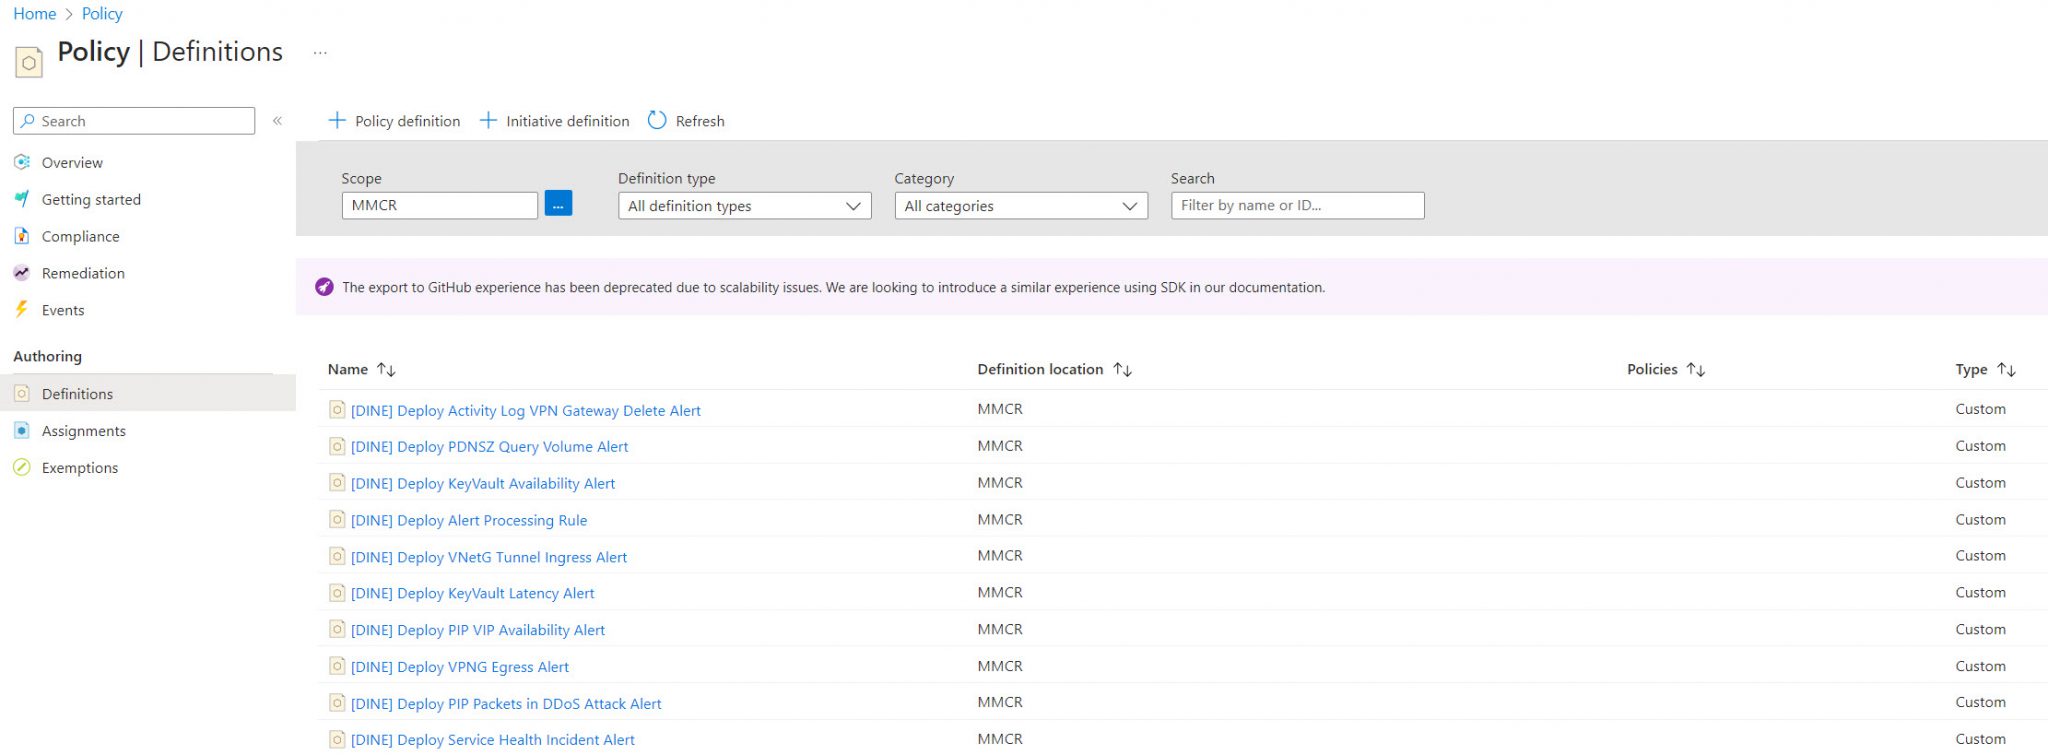
Firstly, run the deployment command to create a set of custom policies. It’s important to create the custom policies in the highest management group possible, normally in the ELZ root management group (the MG beneath the “Tenant Root Group” ). This is because the policy definitions can be created only at or above the policy assignment scope. The command below will create 56 policies prefixed with “[DINE]” (deployIfNotExists).
- Example of deployment command to create the policy definitions: az deployment mg create –template-file ./infra-as-code/bicep/deploy_dine_policies.bicep –location “westeurope” –management-group-id “mg-mmcr”
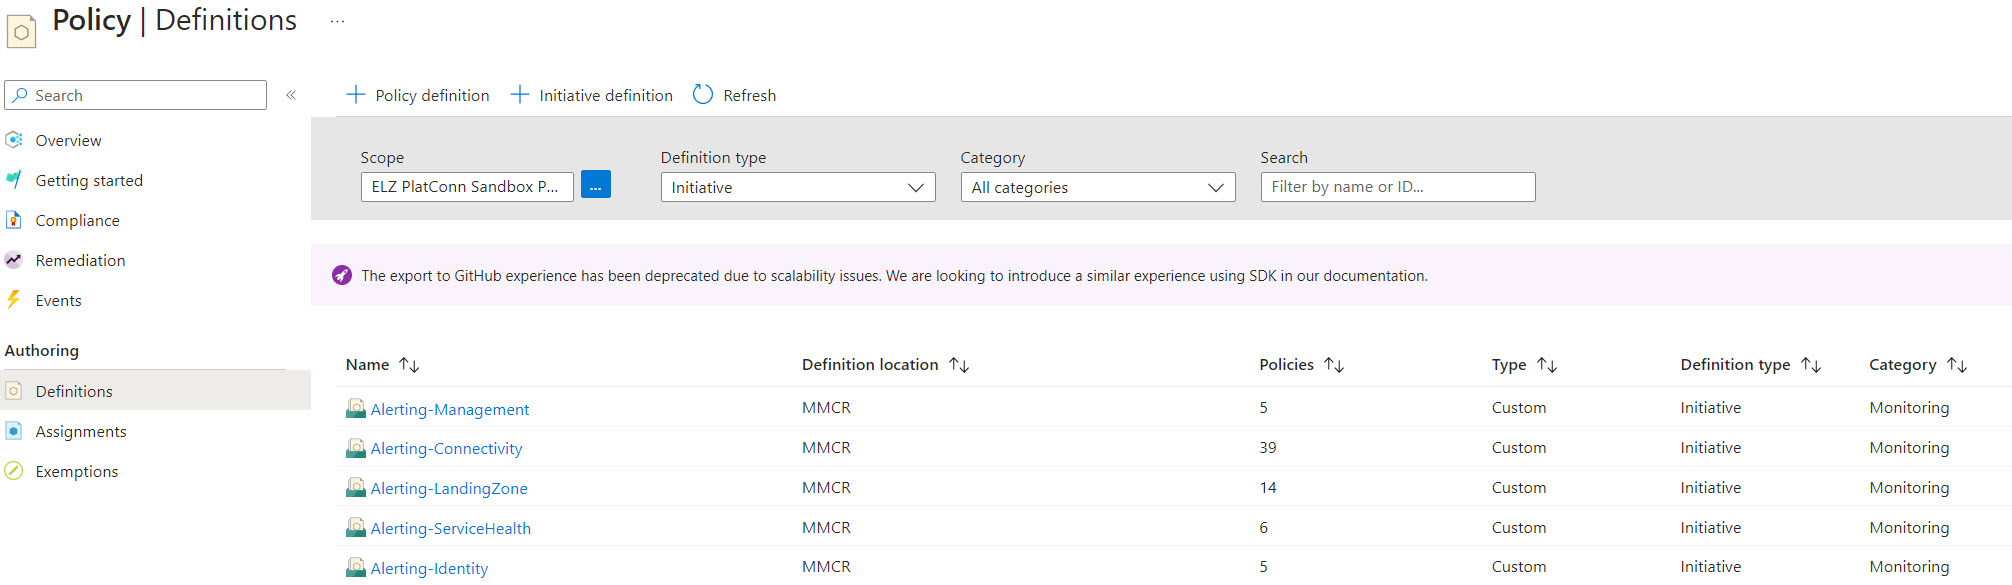
The second deployment command creates the policy initiative (e.g. the connectivity initiative) for the same management group as the step before. The baseline repo contains 5 initiatives: Connectivity, Identity, Management, LandingZone and ServiceHealth. The “Connectivity” initiative contains 39 custom policies that create 35 metrics-based alerts and 4 activityLog-based alerts
- Example of deployment command to create the policy initiatives that groupes: az deployment mg create –template-file ./src/resources/Microsoft.Authorization/policySetDefinitions/ALZ-MonitorConnectivity.json –location “westeurope” –management-group-id “mg-mmcr”
The third and final step is to run the deployment command that assigns the initiative X to the scope Y (normally a management group). Once the policy is assigned, you need to wait a few minutes to see the effects.
- Example of deployment command to assign the “connectivity” policy initiative to the “mg-connectivity” management group: az deployment mg create –template-file ./infra-as-code/bicep/assign_initiatives_connectivity.bicep –location “westeurope” —management-group-id “mg-connectivity” –parameters ./infra-as-code/bicep/parameters-complete-connectivity.json
Before running the deployment command, make sure to:
- Create a resource group in which the activity logs, resource health alerts, actions groups and alert processing rules can be placed (e.g. rg-monitor-prd-we-connectivity).
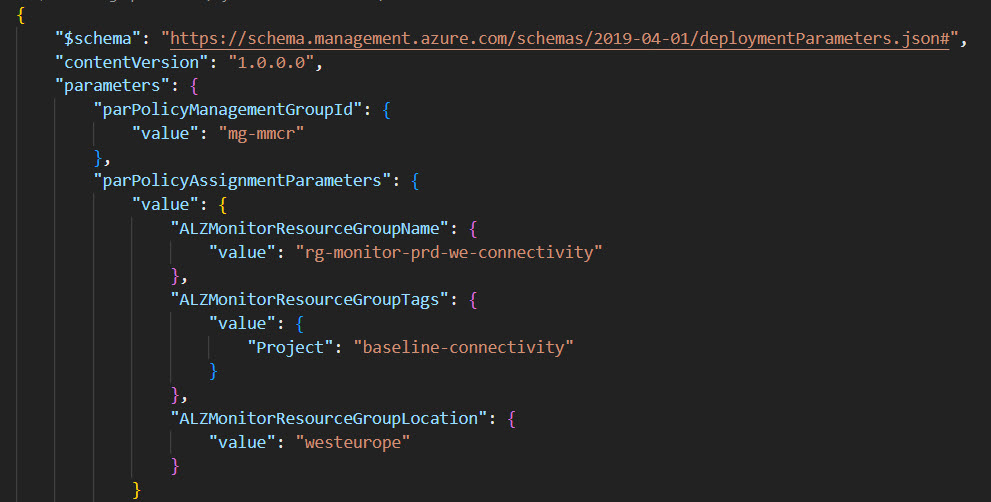
- Edit the parameters-complete-{iniitativescope}.json files to fine-tune your alerts by changing values such as threshold, severity, etc.
For this exercise, I used the default parametrization and changed only the first 4 parameters.
⚠️Important ⚠️ By default, the policies are set to deploy-if-not-exists, ensuring their influence on any new deployments. In a brownfield scenario, where existing resources are involved, policies will report non-compliance for the relevant resources. It is therefore necessary to trigger the remediation to address the non-compliant resources. Remediation can be automatically triggered by using the script provided by Microsoft, as described here.
Examining the outcome
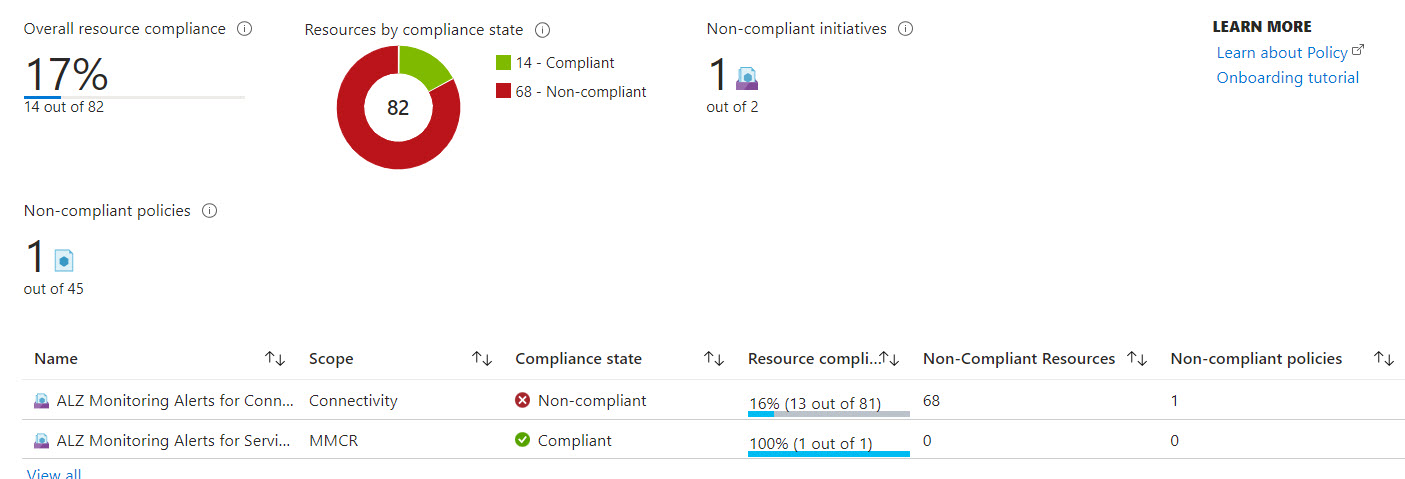
Let’s have a closer look at the result after assigning 2 initiatives (Connectivity and ServiceHealth) and triggering the remediation.
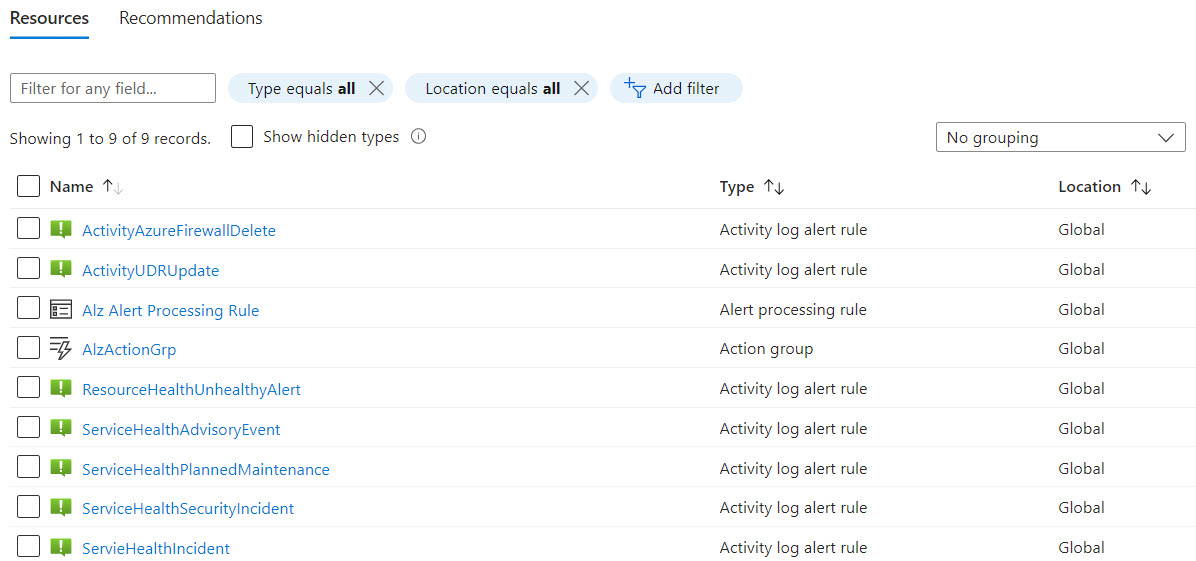
- The ServiceHealth initiative is fully compliant. 4 service health alerts have been created (advisory, security advisory, incident and maintenance ), 1 resource health alert for unhealthy resources and 1 alert processing rule to forward all the fired alerts to the action group named ‘AlzActionGrp’.
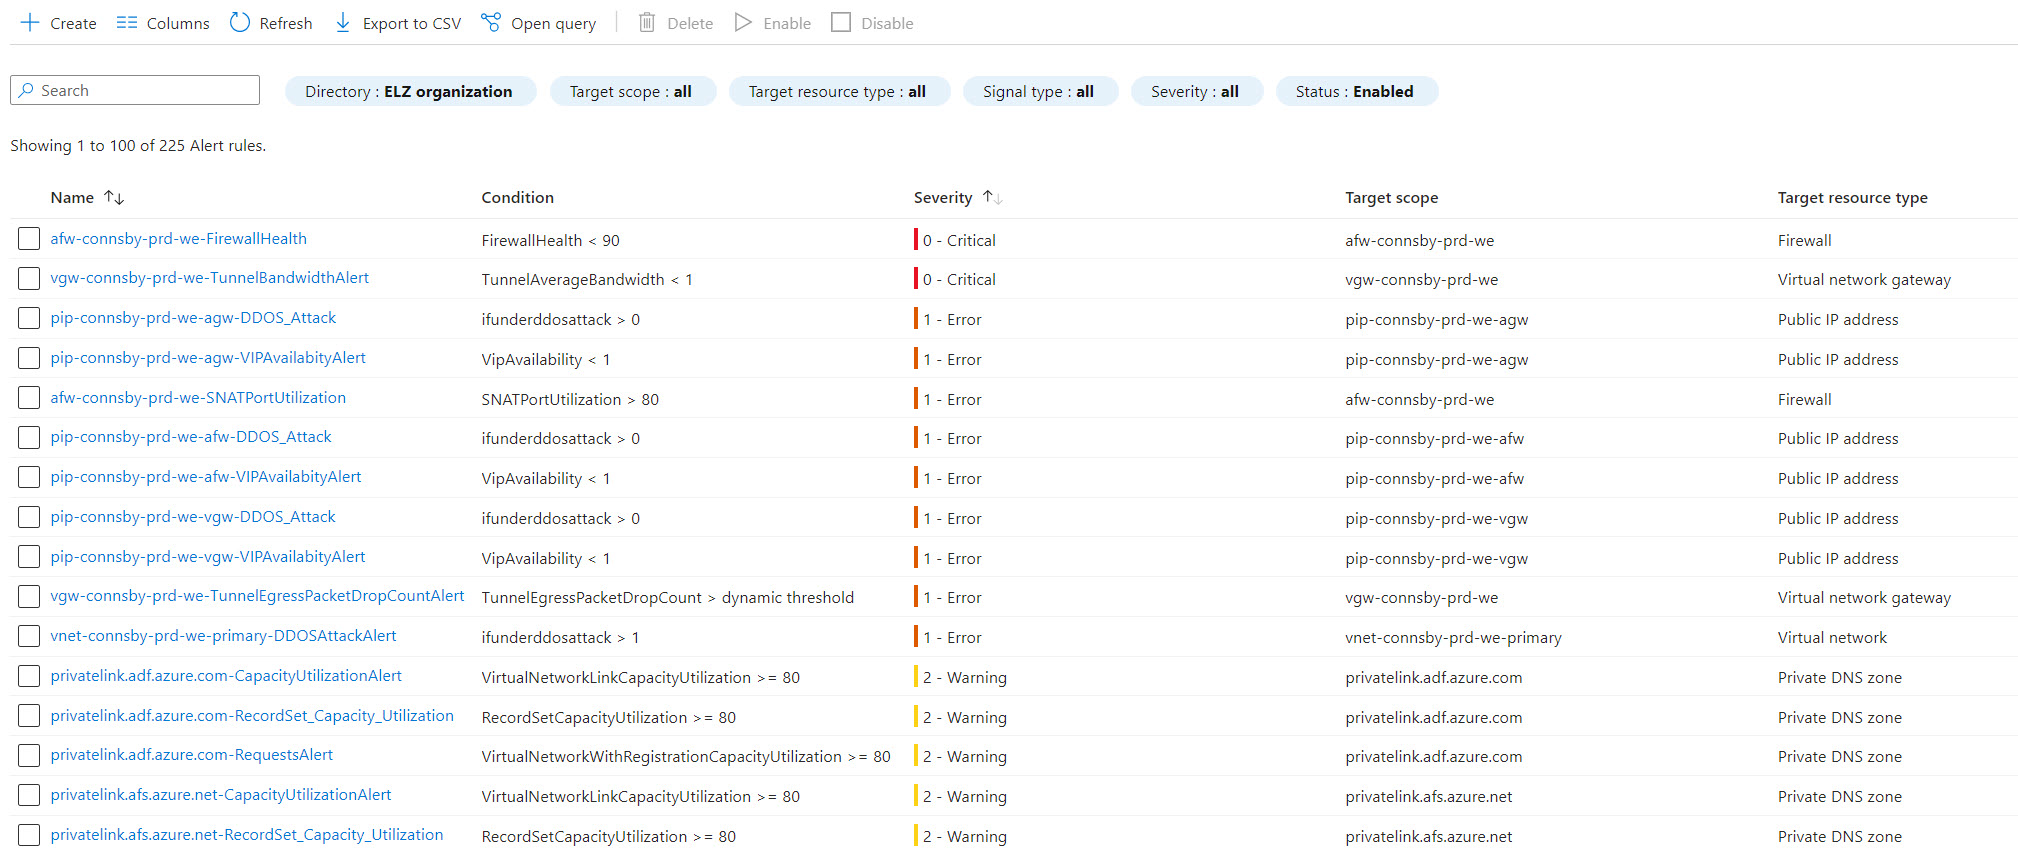
- The Connectivity initiative has 1 policy that is not compliant but because that policy covers 68 resources, the overall resource compliancy is 15%. After triggering the remediation a couple of times, everything turned green 💚 .
- The alert rules have been created in the same resource group as the resource they belong to.
- The Activity Log rules, Alert processing rule and Action group have been created in the resource group we passed as a parameter for the policy assignment.
Pros/Cons
➕Even if I am not a big fan of “deployIfNotExists” policies because I consider them a sort of shadow IT, I have to admit that applying alert rules this way is pretty elegant and effective. Leveraging the policy engine guarantees a simple way to apply the baseline when new resources are deployed, creating a dashboard to make sure the baseline is applied consistently.
➕ I love working with processing rules. Decoupling alerts and actions are a must.
➕ The baseline comes with a remediation script to automate the triggering of the remediations per initiative. This is very handy and saves time.
➖ Alert rules are created by policies so it is extremely important the policies/initiatives are and stay compliant. You need to foresee a system that can continuously monitor compliancy (see the thread of compliance). There are different ways to achieve this: you could use a compliancy workbook, create an activity log alert as suggested here, or setup an event-based notification system like the one described in this blog post.
➖ Troubleshooting a policy assignment can be quite hard and time expensive.
➖ I am not a big fan of the chosen naming convention but it’s not a big deal: we can adjust the code and align it to our company strategy.
➖ Update a parameter for a specific alert rule means redeploying the entire initiative, triggering the remediation and following up on the result. This is quite a time-consuming task.
Conclusion
Establishing an effective monitoring baseline for your enterprise landing zone is critical to maintaining a healthy and performant cloud environment. Microsoft has made our job easier by providing an effective way to roll out alert rules that react to key metrics and logs allowing enterprises to detect anomalies earlier and improve the incident response time. Regularly reviewing and updating the baseline is key to remaining aligned with the evolving needs of your organization and ensuring the long-term success of your enterprise landing zone.
Subscribe to our RSS feed